Explore what your monthly home payment could be.
Enter a rate and see what your payment could look like. Free for homebuyers, homeowners, and real estate agents.
 Equal Housing Opportunity
What brings you here?
I'm buying a home
What it costs each month and at closing, which loan fits, and buyer FAQs.
For homebuyers →I already own a home
Refinancing, home equity, removing mortgage insurance and paying off sooner.
For homeowners →I'm a real estate agent
Calculators with your name on them, plus a daily rate flyer to share.
For real estate agents →Where rates are this week
National averages, so you can see which way the market is moving.
Sources: Freddie Mac, U.S. Treasury, Optimal Blue (via FRED). Market index, not a rate we offer. See the full rate history →
Start with a useful calculator
Purchasing power estimator
See how much home you may be able to afford, using two planning scenarios: Comfortable and Stretch.
Open calculator →Monthly payment
The full estimated monthly cost of a home: principal, interest, tax, insurance, HOA and mortgage insurance.
Open calculator →Rent vs. buy
Compare the total cost of renting with buying over the years you expect to stay.
Open calculator →Seller credit vs. price cut vs. rate buydown
Compare three ways to use the same amount of seller money: lower the price, cover closing costs, or buy down the rate.
Open calculator →Debt-to-income ratio
See what share of monthly income goes to housing and to all debts together.
Open calculator →Down payment comparison
See how the monthly payment and cash needed change at different down payment amounts.
Open calculator →Cash purchase vs. financing
Compare paying all cash with getting a loan: cash needed, interest paid, and cash kept free.
Open calculator →VA loan estimator
Estimate the monthly payment and VA funding fee on a VA-backed home purchase.
Open calculator →Cash to close
Estimate the cash a buyer needs at closing: down payment, closing costs and prepaid items.
Open calculator →Seller net proceeds
See what a seller may take home after the sale, and the price needed to reach a target.
Open calculator →Refinance break-even
See how long a refinance takes to pay for itself, and what it does to total interest.
Open calculator →Extra payments
See how much sooner a loan is paid off, and how much interest you save, by paying a little extra each month.
Open calculator →Points and rate comparison
Paying points can lower your rate but adds cost up front. See how many months it takes for the lower payment to make up that cost.
Open calculator →Home equity and mortgage insurance
See your equity, your loan-to-value ratio, and how far you are from 80% of your home's value. An equity calculation, not a mortgage insurance decision.
Open calculator →Amortization schedule
See every payment split into principal and interest, with the balance after each one.
Open calculator →Total cost of a loan
Add up principal, interest, points and closing costs to see what a loan costs in total.
Open calculator →Loan comparison
Compare two loans side by side: monthly payment, total interest, and when the lower-rate loan starts to save money.
Open calculator →Temporary rate buydown (2-1, 3-2-1)
See the payment in each early year of a temporary buydown and the total amount that has to be funded to cover the difference.
Open calculator →Assumable loan vs. a new loan
Compare taking over a seller's existing loan, with the cash needed to cover the gap, against getting a new loan at today's rate.
Open calculator →Rental income vs. payment (DSCR)
See how a rental's income compares with its full monthly housing payment, the ratio some investor loans are based on.
Open calculator →Not sure which loan fits? Read the loan program guides — conventional, VA, FHA, USDA, jumbo, self-employed, investor and reverse mortgage.
Your path to a home loan
Understand where you stand, compare your options, and get guidance through closing.
1Discuss your goals and prequalification
We'll discuss your budget, income, debts and savings to explore a preliminary price range and next steps.
2Work toward preapproval
We'll guide your application and secure document submission. With your authorization, we'll review your credit and finances to assess potential eligibility for lender preapproval.
3Understand your options
We'll explain the review outcome, estimated payments and suitable loan programs, including anything to address before you qualify.
4Compare rates and total costs
We'll help you shop lender options, compare rates, points and closing costs, discuss opportunities to improve terms, and review your Loan Estimate when issued.
5Move through approval and closing
Once you're under contract, we'll help coordinate documents and lender requirements through underwriting, final lender approval and closing, keeping you and your real estate agent informed.
Calculator results are estimates, not prequalification or preapproval. Prequalification is preliminary, and preapproval is conditional. Neither guarantees a loan. Final approval depends on lender underwriting, the property and outstanding requirements. A Loan Estimate describes proposed terms and costs; it is not an approval.
Whatever your situation
Find yourself below. A quick conversation tells you what you may qualify for. No pressure, no obligation.
Good credit or bad credit?
Let's look at it together. There may be more options than you think.
Short on down payment?
Low and no down payment options for those who qualify, including conventional loans, FHA, and down payment assistance programs.
Military or a veteran?
VA loans can include low and no down payment options for those who qualify.
Want a lower starting rate?
An adjustable-rate mortgage (ARM) can start lower than a 30-year fixed. We'll show you when that makes sense and what happens when the rate adjusts.
Self-employed, investing, or buying a higher-priced home?
There are loan programs for those too. Let's find the one that fits.
The calculators on this site never check your credit; preapproval does, with your permission. Low- and no-down-payment, VA and other programs have their own eligibility rules. Availability and terms depend on the lender, the program and your situation, and approval is not guaranteed.
Send your clients a calculator with your name on it
Share simple home-buying calculators branded with your name and contact details, and see which ones your clients use.
- Sign in and add your real estate license number. We confirm it, usually within one business day.
- Send calculators, the daily rate flyer and your digital business card from your dashboard.
- ZeroToKeys does not pay or accept payment for referrals. Tools for real estate agents are offered without any requirement to refer business. Your clients can use any lender.
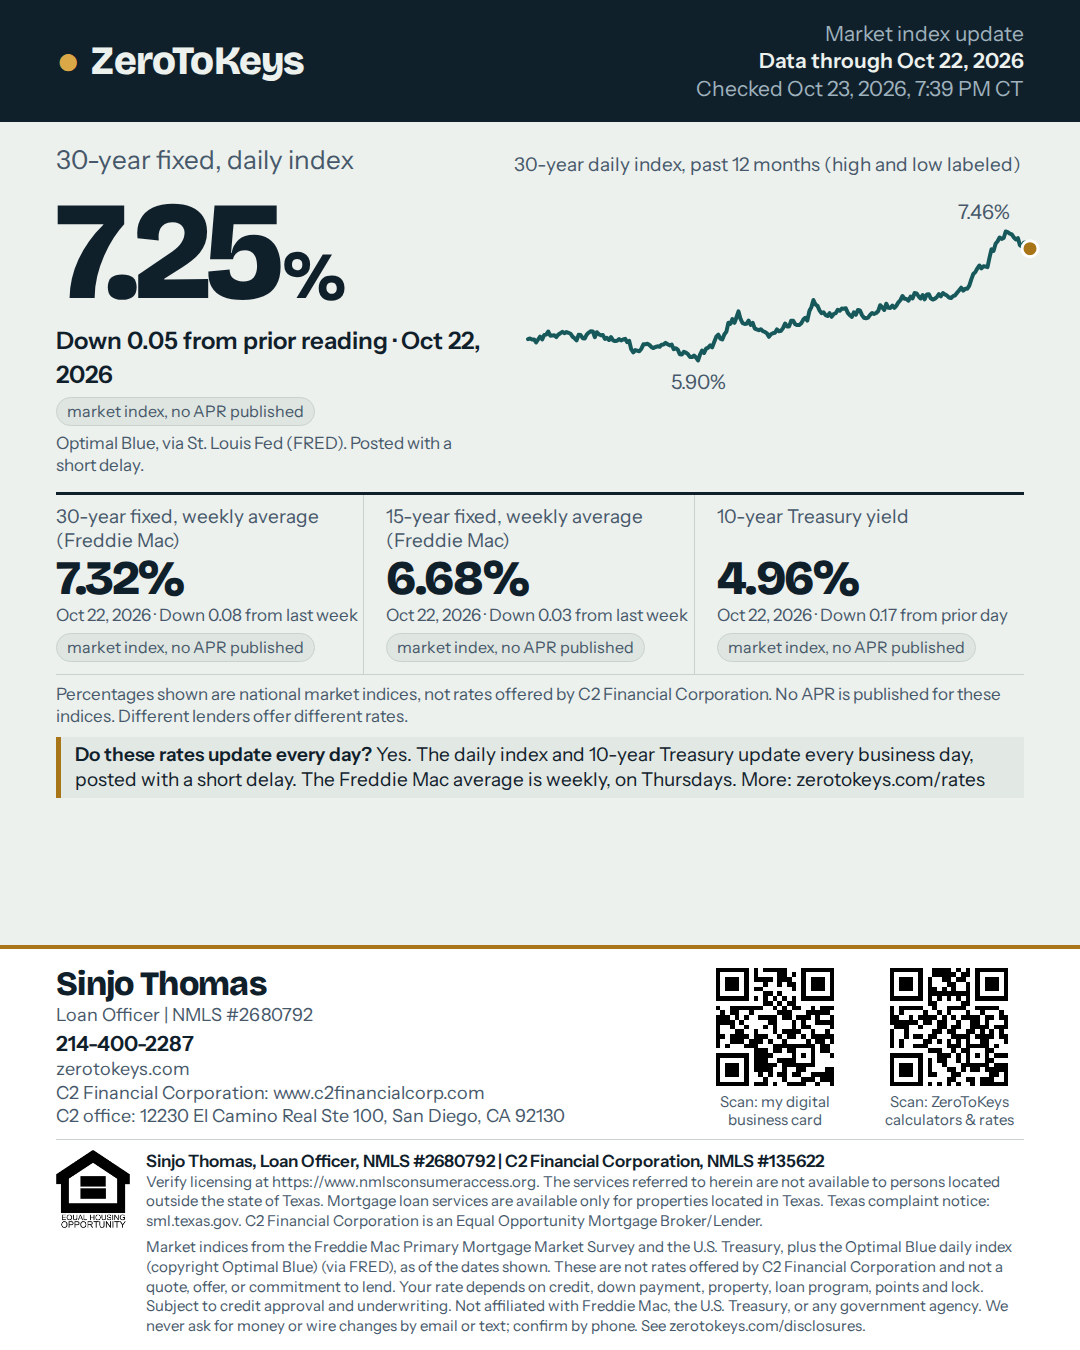
Daily flyer for real estate agents
One image with the latest national market indices, ready to post in a group chat or show at an open house. Data through Oct 22, 2026 · checked Oct 23, 2026, 7:39 PM CT.
Every percentage on the flyer is labeled market index, no APR published. The licensing and Texas disclosures are built in, so please share it as it is.
Example Realty · (555) 555-0100
See what your payment could look like
Frequently asked questions
Who is behind ZeroToKeys?
ZeroToKeys is a free home-buying education site backed by a licensed loan officer with C2 Financial Corporation (NMLS #135622). The calculators and guides are free, with no sign-up. About and licensing →
Are the rates on this site an offer?
No. The rates page shows national market averages so you can see which way the market is moving. Your rate depends on your credit, down payment, property and loan program. See market rates →
Will reaching out hurt my credit?
No. Asking questions and running the calculators never checks your credit. Your credit is pulled only with your permission, usually at preapproval.
Where do you lend?
The services referred to herein are not available to persons located outside the state of Texas.
Mortgage loan services are available only for properties located in Texas.
How do I reach you?
Send the form below, call or text, or chat on WhatsApp. You will hear back from a licensed loan officer, usually within one business day. Get in touch →
More answers: homebuyer FAQ · homeowner FAQ
Tell us what you're trying to do
Send a few details and we'll follow up, usually within one business day. No credit check to reach out, and no obligation.
Start a conversation
Chat on WhatsApp Prefer to chat? You'll see the message before you send it.